

We were able to establish baseline “norms” in the form of Shewhart charts for indicators that could be broadly categorised as indicators of change in:
(i) population demography because of altered recruitment, survival and mortality. Measures were:
- proportion females;
- proportion of first-year birds (having hatched in that calendar year or in the preceding calendar year);
- proportion of deaths from starvation or disease.
(ii) nutritional status measures were:
- body weight;
- fat score;
- condition index.
Descriptions of how these indices are calculated can be found in the supporting PBMS report.
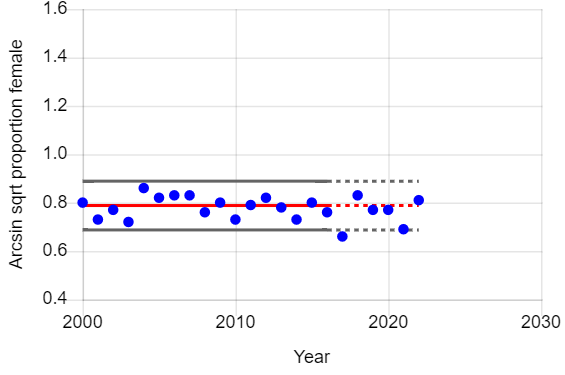
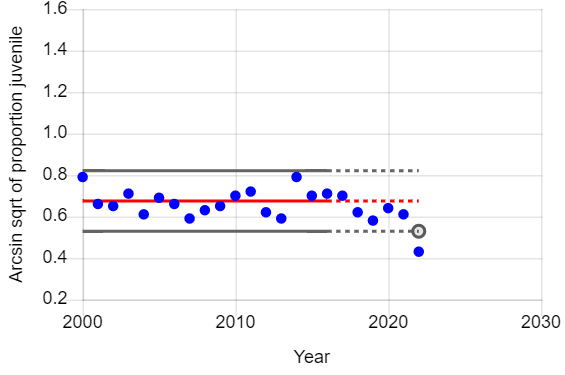
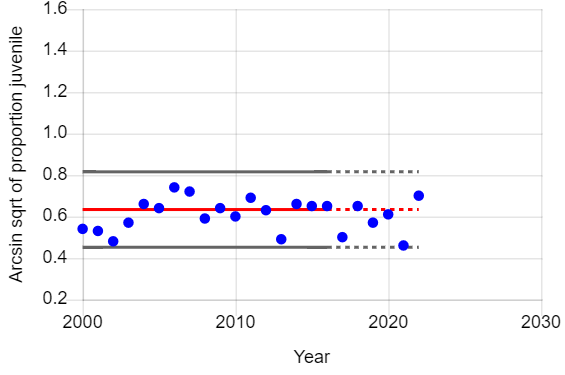
Where the health index reports as a proportion of the population (e.g. percentage of females) then for statistical reasons the index is presented as the arcsine of the square root of the proportion. This value can theoretically range between 0 and 1.57, representing 0% and 100% of the population, respectively.
Proportions
The proportion of female and juvenile birds in each year's sample. Years where the value falls outside of the 95% prediction intervals may indicate change in the demographic structure of the species population.
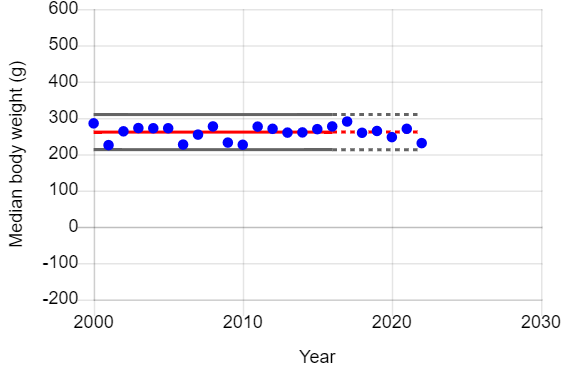
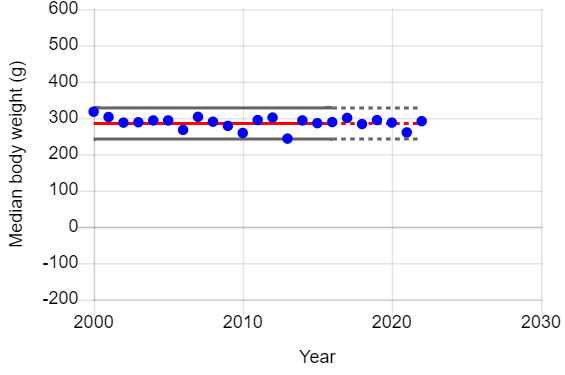
Body Weight
Median postmortem body weight of birds each year for different sexes and ages of birds. The sample size in any single year was at least 5 birds to be included. Years where the value falls outside of the 95% prediction intervals may indicate change in the physical condition birds in that particular demographic which may indicate, in the case of years below the lower 95% prediction interval, that food availability may be restricted.
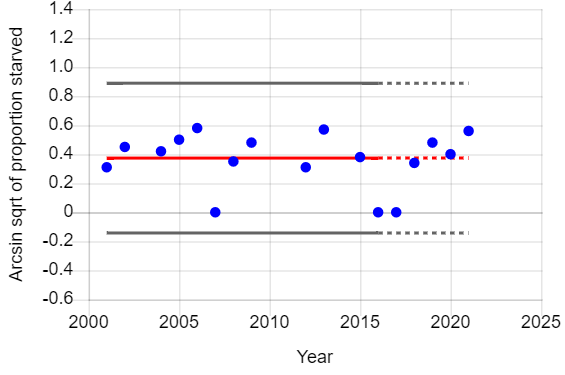
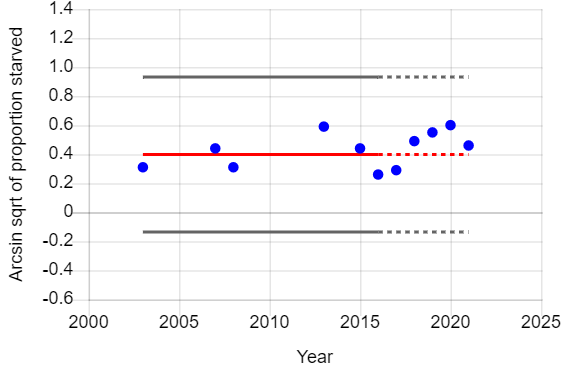
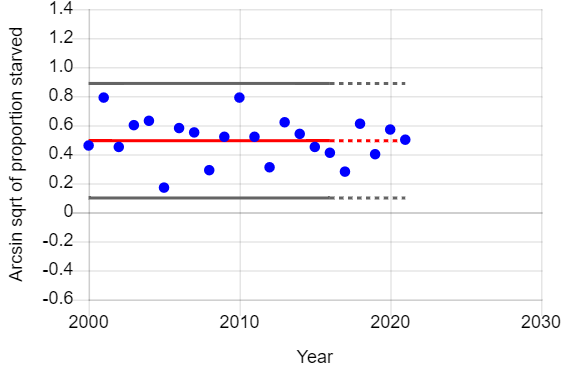
Putative cause of death
The proportion of birds that died of starvation or disease in each year. Years that fall below the lower 95% prediction interval indicates that there are fewer starved birds in the population (or demographic group), conversely an increase above the upper 95% prediction interval indicates there are more starved birds.
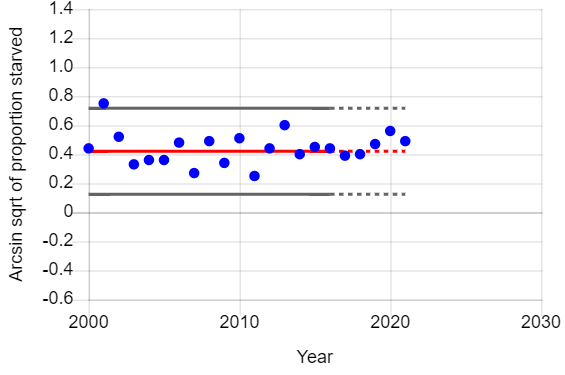
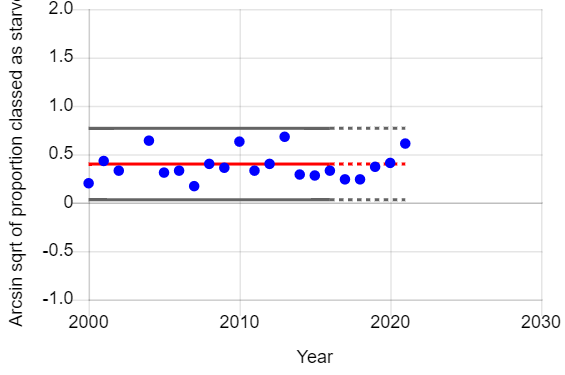
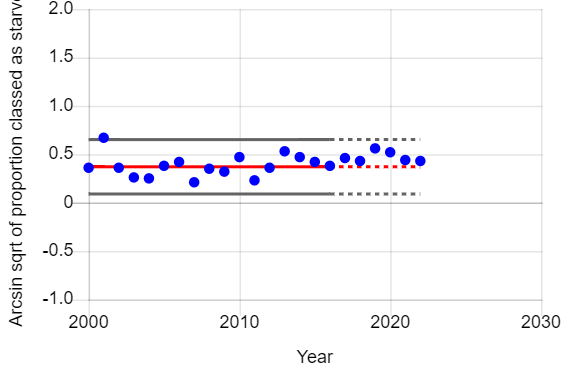
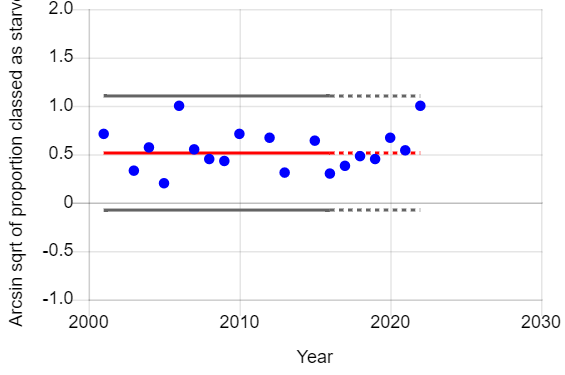
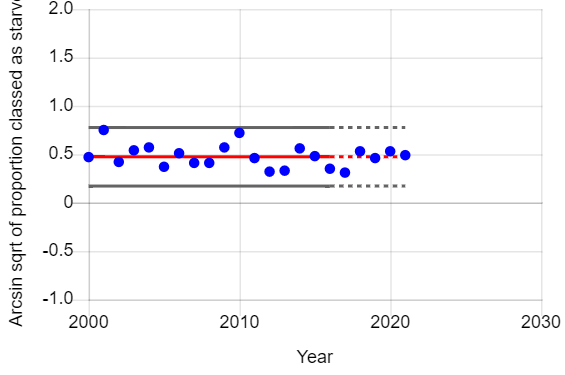
Fat score
The proportion of birds categorised as starved each year, based on their fat score. Years that fall below the lower 95% prediction interval indicates that there are fewer starved birds in the population (or demographic group), conversely an increase above the upper 95% prediction interval indicates there are more starved birds.
Condition
In the graphs below, years for which the average condition index (CI) is below the lower 95% prediction interval indicates that there are fewer birds with low fat reserves in the population (or demographic group), conversely an increase above the upper 95% prediction interval indicates there are more birds with low fat reserves. Low fat reserves means a bird is less likely to survive prolonged periods where they are unable to hunt successfully, or that the bird has starved. The condition index is used as a continuous measure of body condition, rather than categorical such as fat score.
The mean condition of birds per year was calculated for different ages and sexes. The Condition Index is calculated as follows:
CI = (BW - GW) / SD
where:
- CI = Condition Index
- BW = whole postmortem body weight (g)
- GW = Wet weight of gizzard contents (g)
- SD = Sternum diagonal, which is the distance between the posterior point of the sternum keel plate and the distal point of the clavical (mm)
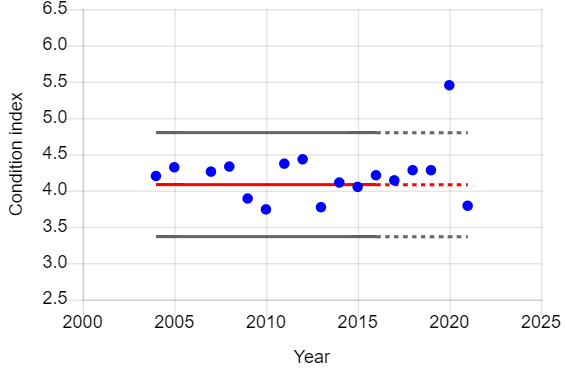
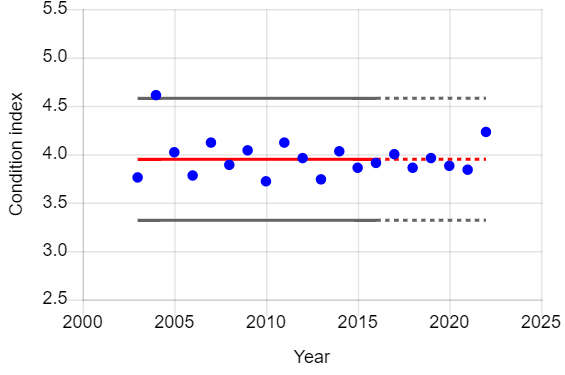
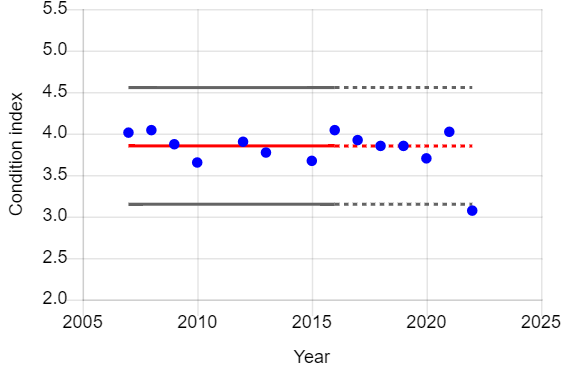
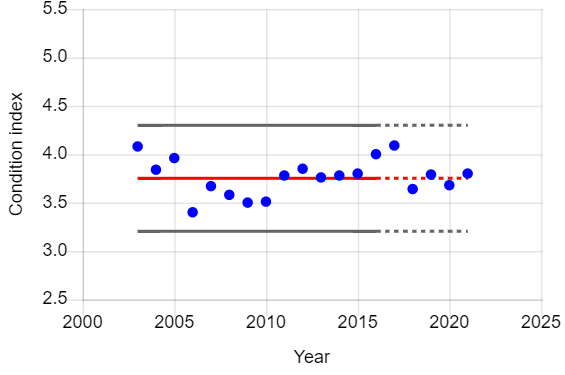
Photo: Saxifraga: Martin Mollet